Bristol Bridges Walk
I was teaching Engineering Mathematics at the University of Bristol when it happened: “Is that possible in Bristol?” one of my students asked. It was a reasonable question. I had been talking about the Königsberg Bridge Problem, the foundational problem that created Graph Theory and by extension modern Network Science.
The problem asks if one can go on a walk in historical Königsberg that crosses each of the towns bridges exactly once. The answer is no: Before you can complete the walk you will always trap yourself on an island that you can’t leave again without crossing a bridge for the second time.
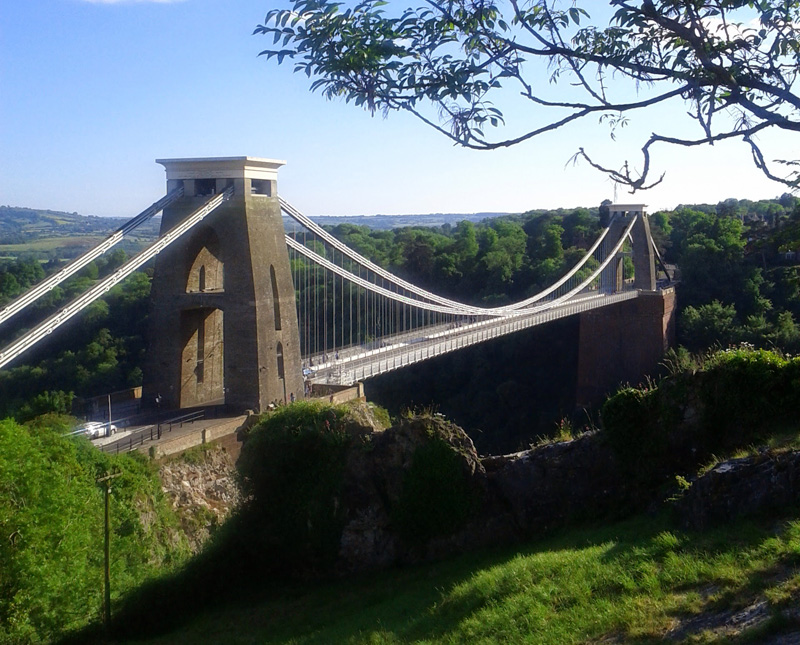
But was it possible in Bristol? It’s an interesting question. Bristol has a population of six-hundred thousand, very similar to Königsberg, which now goes by the name Kaliningrad. Like Königsberg, Bristol is build around the last crossing on a major river, approximately five miles from the coast. And like Königsberg, Bristol is famous for its bridges: One of it’s main attractions is the Clifton Suspension Bridge, and one of the most notable events in Bristol’s history is the Bristol Bridge Riot. The very name Bristol derives from Brycgstow, Anglo-Saxon for The Place of the Bridge.
Bridgewalk on Youtube
I have made a couple of videos about the Bristol Bridgewalk, in which I explain the theory behind the walk while walking it.
Königsberg Bridge Problem
Leonard Euler’s solution of the original Königsberg problem was so beautiful that it triggered the development of Graph Theory, the foundation of modern Network Science.
If you want to read more about the original problem you can do so in this post.
What’s a Bridge?
Making mathematics relevant to the real world always requires a special glue that we call modelling. Mathematics has clear criteria for the existence of eulerian walks, that is walks that cross ever edge in a graph exactly once. But a graph is a mathematical object and a city with its rivers and bridges is not. Maths in itself does not know what a bridge is, that is for the modelling to decide.
When I tried to decide if the Bridgewalk is possible in Bristol I quickly ran into two problems: What is a bridge? And what is Bristol? You might assume that answering these questions is easy or if not easy it is at most a superficial and profoundly uninteresting. But modelling is an essential part of making maths relevant in the real world. It has its own challenges, but if we take these challenges seriously we often gain a much deeper understanding of the system we are dealing with.
But it’s clear what a bridge is isn’t it, I hear you asking. No, it’s not. Using tools like open street map and satellite imagery it is easy to locate bridges and you find a lot. Some will be major bridges over rivers that are unambiguously bridges. But some are little footbridges, some are part of lock gates on canals, some bridges cross roads not not rivers, some are parts of lock gates, some are places where the river briefly disappears into a pipe to cross under a road, some are motorway bridges or train bridges that have no pedestrian walkways, some only carry and some only carry pipes or cables across the water. In the heart of Bristol even the platforms of Temple Meads railway station cross a river, though you wouldn’t be able to step off the platform on the other side. Which of these counts as a bridge? Similarly we can ask what is Bristol? The extent of the city? The historical city wall? The county? or maybe the church parish, or the election district?
For about two weeks I was stuck on these problems, of course I could have made arbitrary choices, but I wanted a principled solution. Eventually an idea occurred to me: Consider the original problem from Königsberg. Original challenge was about finding a nice walk that the gentry of the city to enjoy. So everything that was not legally walkable was out. Furthermore the Königsberg Bridge Problem is a puzzle. Clearly including a bridge across a road would not add to this puzzle as one can quite easily walk around these bridges if we needed to avoid using them a second time. For the same reason all bridges across minor canals etc that are disconnected from the main river do not add to the puzzle and should therefore not be considered.
Regarding the boundary of Bristol, I chose the county boundary as other potential areas cut some bridges in half. Interestingly that left me with one edge case as there is a motorway bridge that crosses the airspace of Bristol County while starting and ending elsewhere—I decided that it does not count for the challenge.
Clifton Suspension Bridge
Eulerian Ramblings
In 1736 Leonard Euler proved that a walk that crosses every bridge exactly once is possible if there are at most two landmasses that connect to an odd number of bridges. If no landmass has an odd number of bridges then the walk is not only possible but also leads the walker back to the starting point when they are done.
In Historical Königsberg seven bridges connected the two banks of the river Pregel and two river islets. The bridges were positioned such that one of the islets connected to five of the bridges, while the other islet and both banks had access to three bridges each. That makes four land masses with an odd number of bridges so now walk was possible.
Like Königsberg Bristol is build on the banks of a major river, the Avon, and also occupies two river islands, plus another very tiny one. But when I first started to work on the bridgewalk, there were forty-two bridges only one islet and one of the river banks connected to an odd number of bridges.
At the time of writing three more bridges have been built, so the number has increased to forty-five and now all the islands have an even number of bridges, which makes it possible to go on a walk that crosses each bridge exactly once and returns you to the starting point.
A First Attempt
Once I realized that a walk is possible I knew I had to try to walk it. If a walk is possible with a given set of islands and bridges there are typically many different eulerian walks. Finding a simple formula that can be used to compute the number of eulerian walks in a given network is an important open problem.
If you solve the problem on a piece of paper, any solution will do. But if you actually have to walk it, it changes your perspective: You don’t just want any bridgewalk, you want the best one. The best walk should be reasonably short but that’s not all, you want to stick to nice paths and avoid major roads. At the time I already done several exploratory trips to find out if certain bridges are walkable, and those gave me a good idea on where I wanted to go, and which parts I wanted to avoid.
Mathematics has relatively little to say about optimizing your bridgewalk, which is surprising given that the Königsberg Bridge Problem is very well studied in many other ways. So I developed my own method for the optimization, which worked well.
My first attempt at the walk ended in disaster: On the way I passed the Temple Meads Relief Line Bridge, an enormous steel girder railway bridge, painted in bold blue. In aerial photographs it had looked quite narrow, only carrying a railway track, so it wouldn’t count for the puzzle. But now as I walked past it I saw stairs leading up to it, and indeed what was once a railway bridge had been converted to a pedestrian crossing, so it did count! With the addition of this bridge the walk was still possible, but I had started in the wrong place.
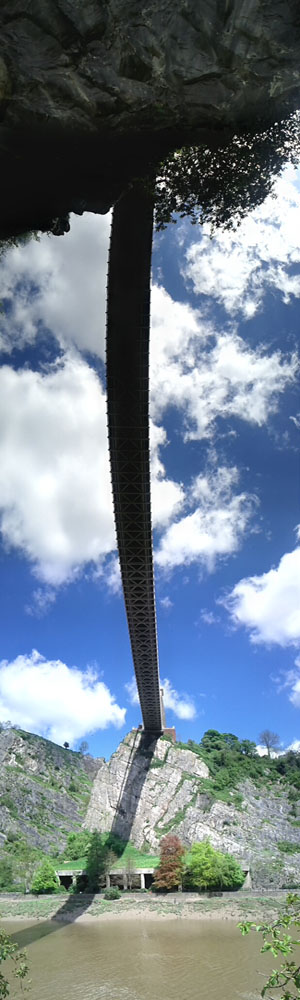
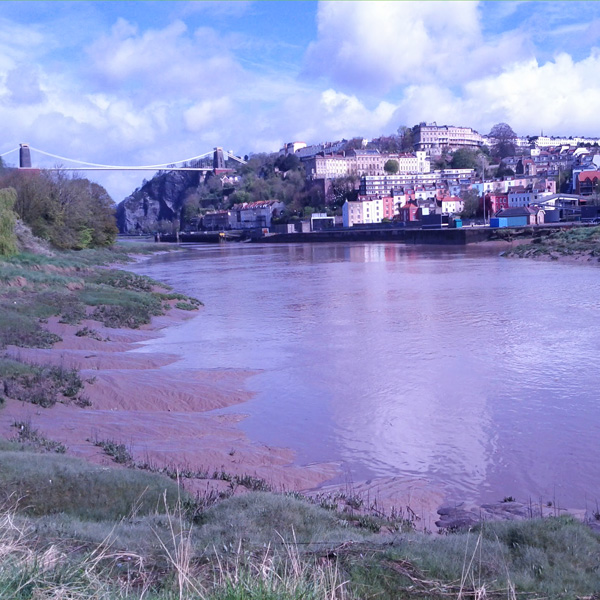
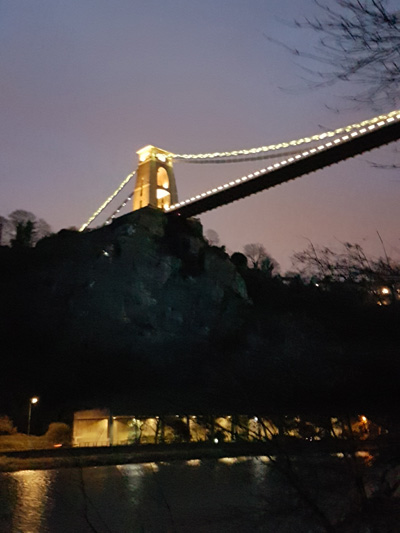
Clifton Suspension Bridge seen from below
The Second Attempt
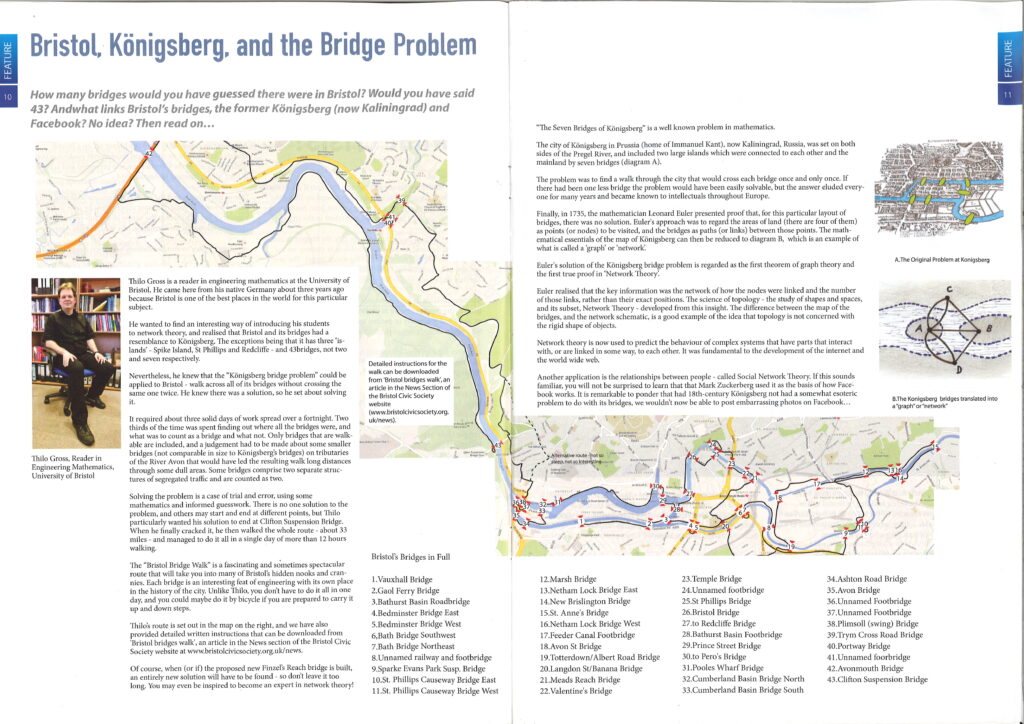
I took two weeks to discover from this first failure before I made another attempt. But I had gained valuable information; on the first try my progress along the sequence of bridges had been slower than expected. On my second attempt I got up up shortly after 4am on a grey Saturday morning. I got ready, made two giant sandwiches, packed a lot of water, and then walked about half an hour to the starting point of the actual bridgewalk.
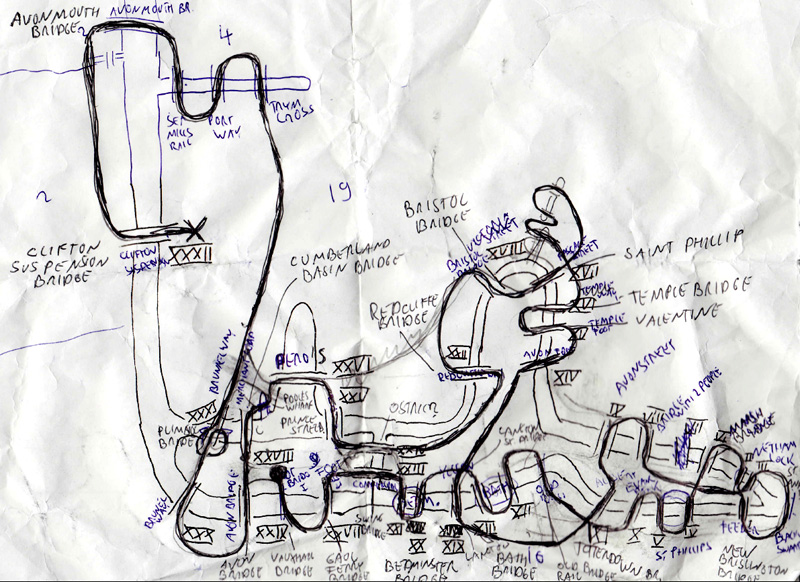
I had made a plan, shown above, that accompanied me on the walk. But it showed only the sequence of bridges. I had planned for some shortcuts I wanted to take using the excellent maps of the British Ordinance Survey. But mostly I was finding the routes between bridges while I was walking. I recorded some video on the way and walked into many dead ends, including two very bad ones. All the way I was worried that I would find another unexpected bridge, but I didn’t.
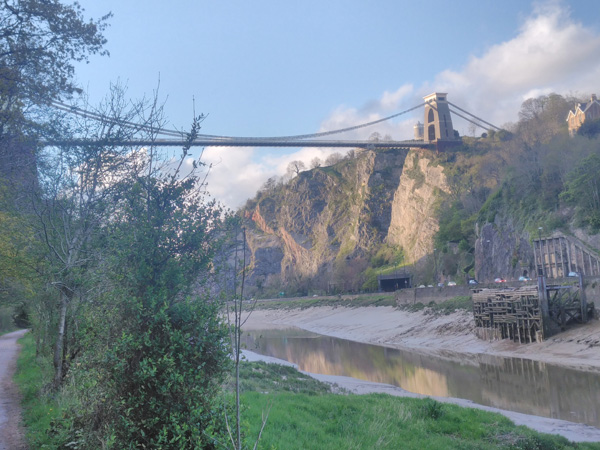
The low point came before the last bridge, that was 48km or so into the walk. I had been walking back toward the centre of Bristol along the Avon, on a beautiful, serene trail. But now night was falling, my last sandwich had long been eaten and now I had to climb up 75 metres to the final bridge. After walking all day without a break it felt like I was climbing Everest. Fortunately this was a part of the walk that I knew well, the trail up to the bridge went through Leigh Woods, one of the wilder and more magical parts of the countryside. In the evening light it was beautiful, but I also knew that within the next half our it would become pitch black, and I did not fancy getting lost in the woods at night.
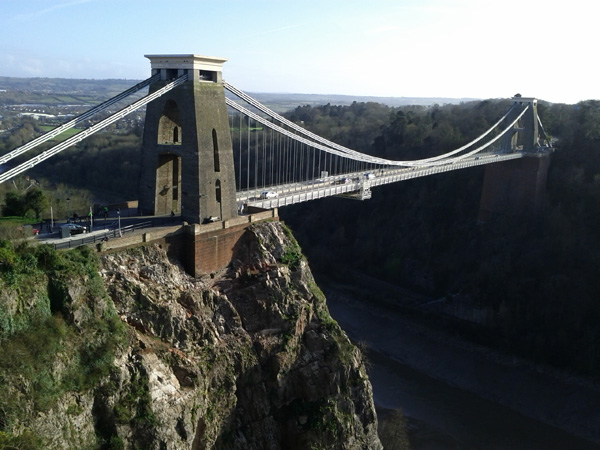
I made it to the top of the woods as the light slowly faded. From there it was a short walk along a road. Shortly after 6pm I crossed Clifton Suspension Bridge, completing the walk. I had walked all day and covered 33 miles (53 km) but I had crossed each bridge exactly once.
Reception
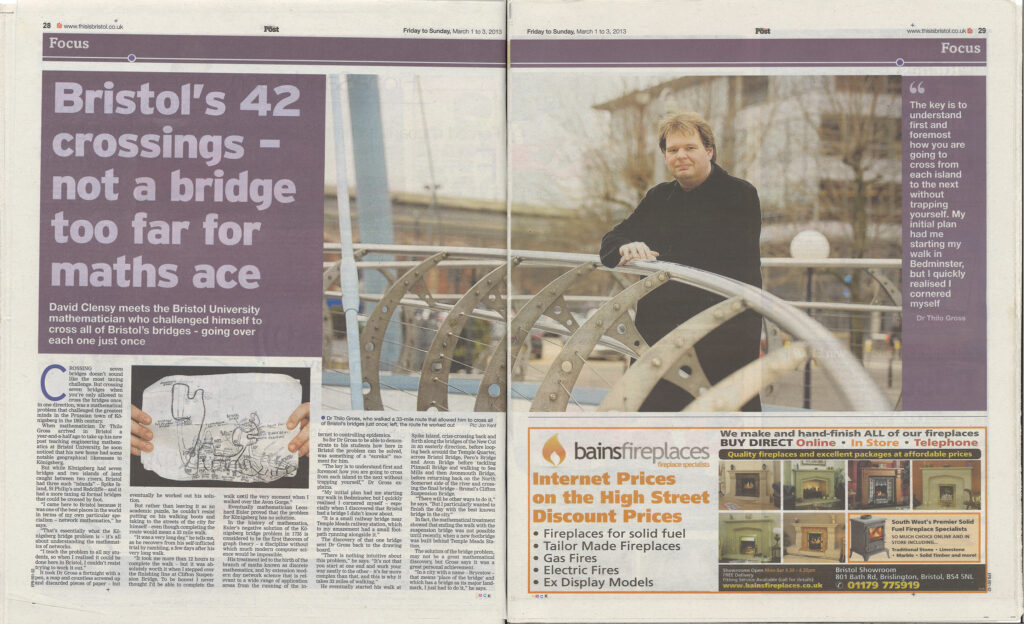
Up to this point I had thought of the bridgewalk as something that I did for myself. But while walking I had some time to think, and I thought if this is interesting to me maybe it is interesting for other people as well—perhaps I should write a press release? Normally we do press releases for scientific results, but this was interesting, wasn’t it, maybe someone would pick it up?
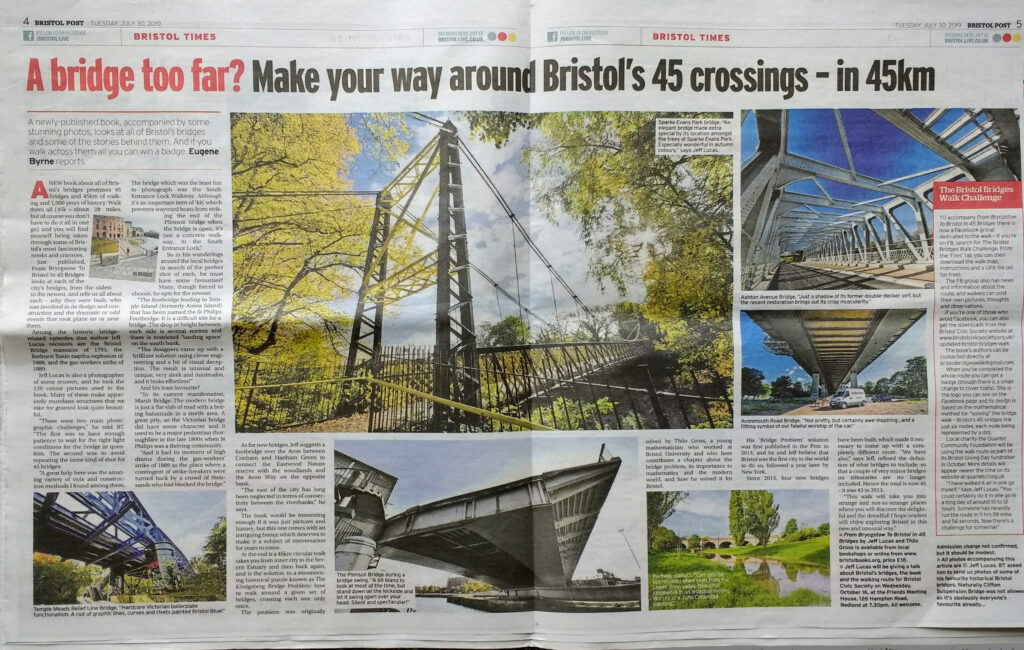
Next thing I knew the bridgewalk was getting double-page coverage in major newspapers and I was talking to the BBC. Even before that my scientific work had received coverage, arguably even in more important media such as the New York Times, Wall Street Journal or National Geographic. But his was different, particularly the detailed fairly high-intensity coverage meant that for a week or so people recognized me in the street.
Also for he first time in my life public attention somehow sustained itself. I received a lot of requests for walking instructions. Other people did the walk and posted on social media about it. A cancer survivor ran the route as an extended marathon to raise money for a cancer charity and that brought a new wave of attention. People started to blog about it, and I received more requests for interviews. Many people did the walk for fun or as part of smaller fundraising events. Later it would become the headline event of Bristol Giving Day in 2022 and Christian Climate Action declared it as a pilgrimage.
Alan Champneys asked me if I wanted to contribute a chapter to the book “50 Visions of Mathematics” that was being published for the fifties anniversery of the UK’s Institute of Mathematics and it’s Applications (IMA). I agreed, wrote my chapter and only later discovered that other contributions were by famous authors such as Simon Singh.
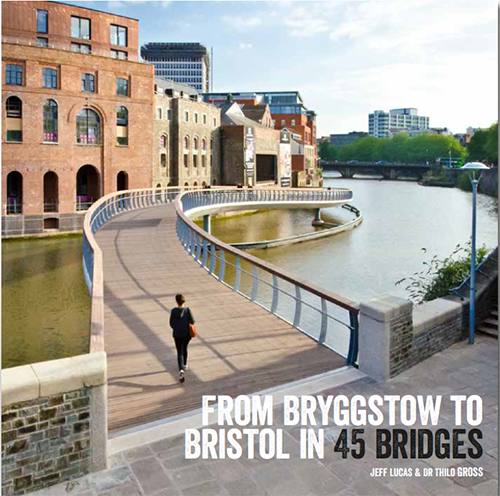
During an interview for Better Bristol, I met Jeff Lucas, the president of Bristol’s Civic Society. Jeff became fascinated with the idea of the bridgewalk. He started researching the bridges and the stories they tell, and started taking pictures of all the bridges. Jeff is an amazing photographer, and he aimed to photograph every one of the bridges in ways they hadn’t been shown before. Eventually he compiled his photographs and stories about the bridges into the book “From Bryckstow to Bristol in 45 bridges,” to which I contributed some mathematical explanations.

The Bridgewalk Today
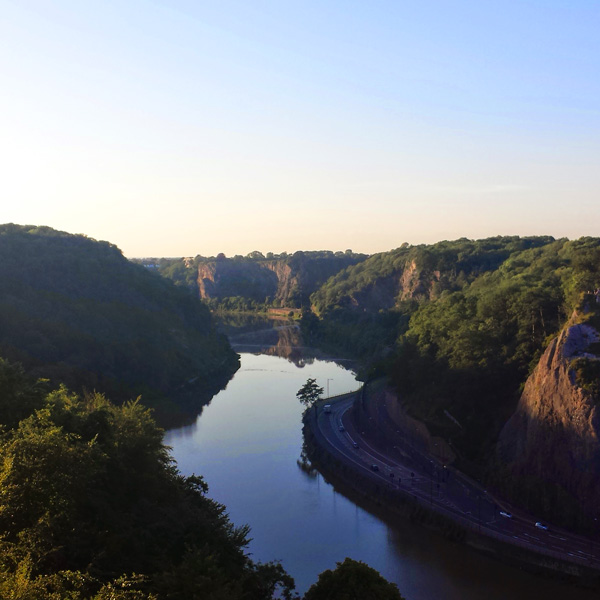
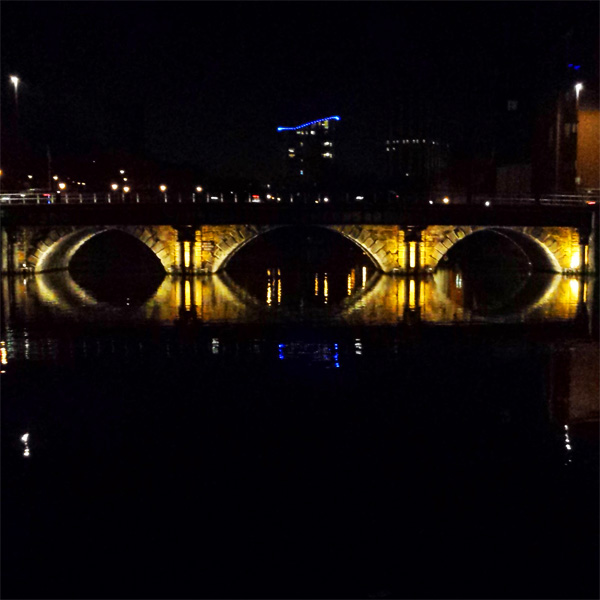
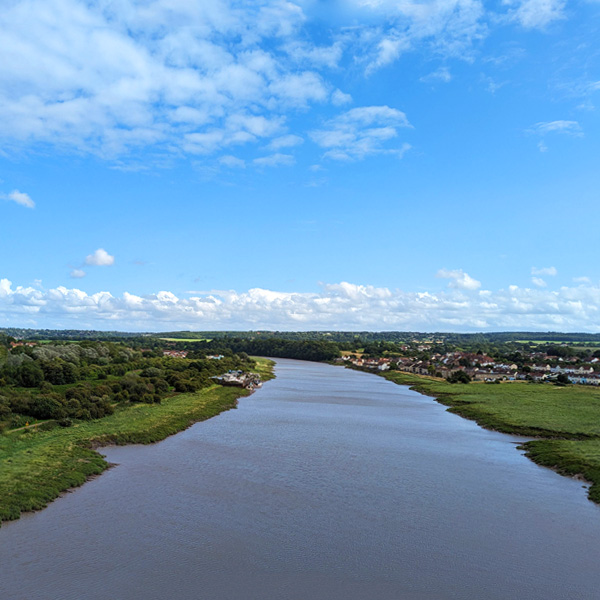
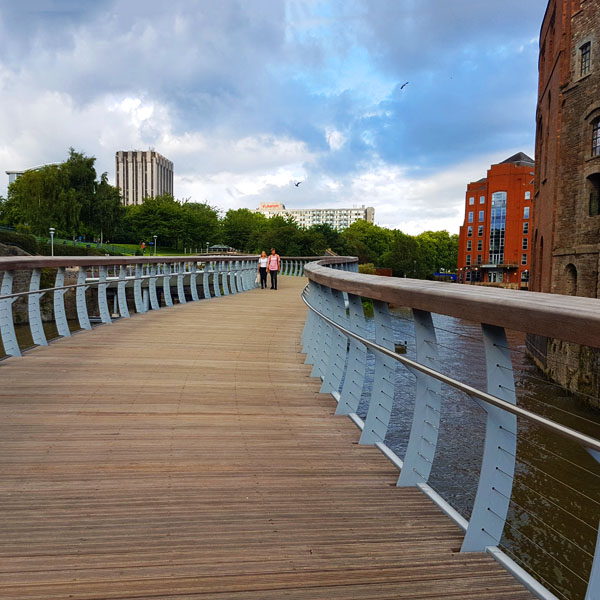
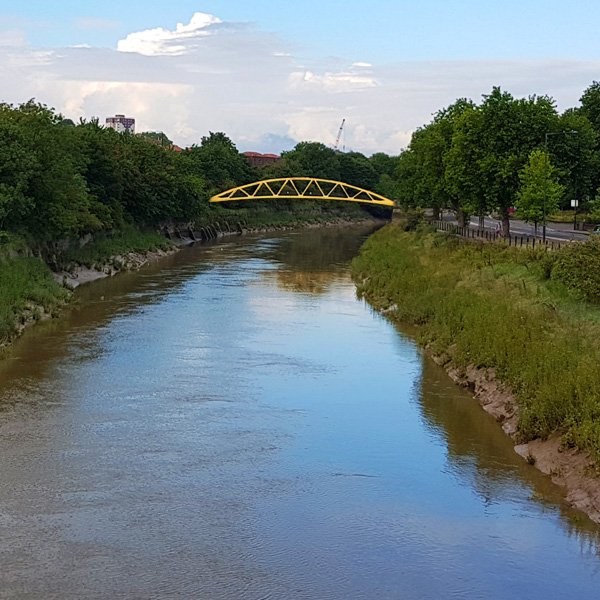
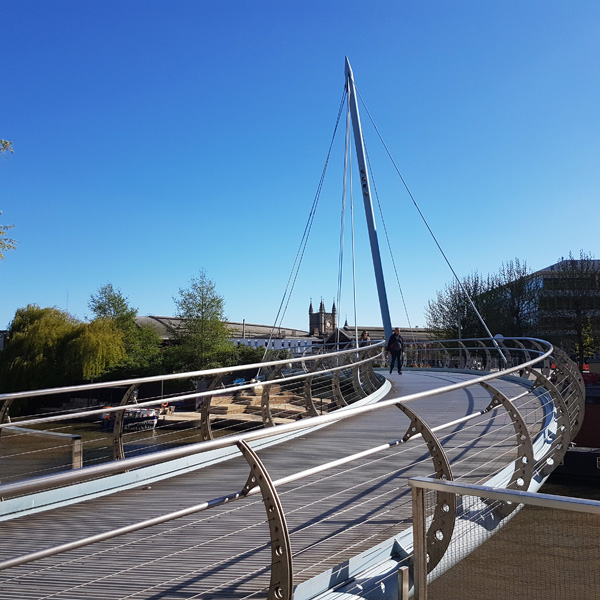
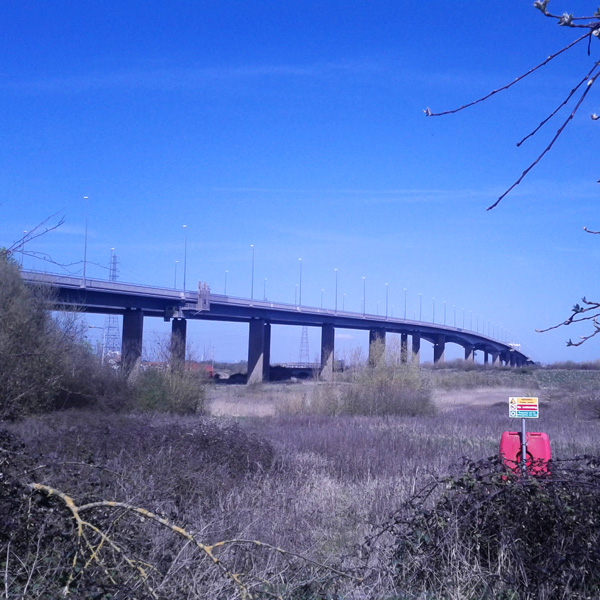
Today the bridgewalk remains a fascinating walk, weaving back and forth around the Avon and its tributaries. Clifton Suspension Bridge remains the highlight of this walk, but the each bridge has a story to tell, and each has its own character, from the steam age aestetics of Vauxhall bridge, to the playful Victorian Gaol Ferry Bridge, the brick arches of Portway Trym Bridge, the ultra-modern stainless Meads Reach bridge, or the mile-long brutalist Avonmouth bridge.
With the addition of more bridges the bridgewalk is now a cyclical route.
As different as the bridges are the parts of Bristol that the walk visits, form the lively city centre to the serene Avongorge, the Street Art of Spike Island, the Villa’s of Clifton and Victorian factories on Silverthorne road. The walk has it all.
Today the Bristol Bridge Walk has a wikipedia page and a lively community on facebook, which has recently also become a centre a rallying point for activism to keep Bristols bridges and footpaths open to the public. The facebook community has current information on the bridges and many people posts the photos of the walk there.
There are now also alternative routes for bikes and mobility scooters.
Some Links
- Bridgewalk on Wikipedia
- Walking Instructions and Map @ Bristol Civic Society
- Facebook Community
- The Book: “From Bryggstow to Bristol in 45 Bridges”
If you complete the walk you can get the official Bridges Walk pin for this and other enquiries please contact: bristolbridgeswalk@gmail.com